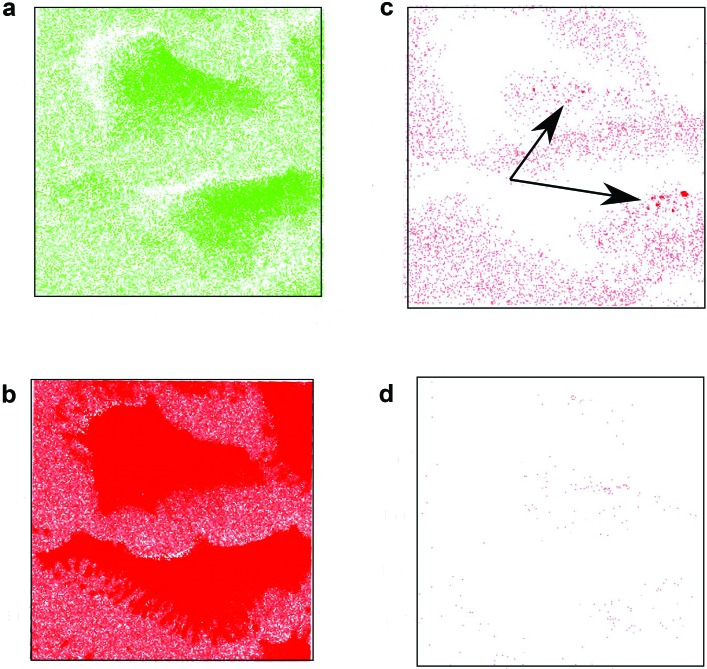
Fig. 2.
ToF-SIMS data before and after background subtraction. Images from before [(a) and (b)] and after [(c) and (d)] for polymer [(a) and (c)] and cell [(b) and (d)]. The arrows highlight the location of the punctate spots in the polymer image after background subtraction. The polymer signal is the sum signal from the peaks in Table I. The cell signal is m/z 26 (CN). Similar results are obtained for other cell related peaks.

