Fig. 3.

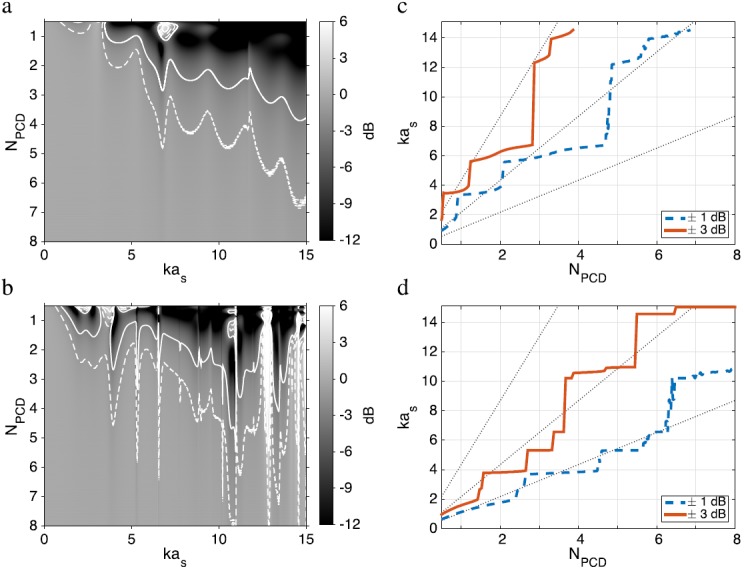
(Color online) (a) Decibel-scaled ratio of simulated PCD-measured to hydrophone-measured pressure for a silica glass sphere as a function of normalized sphere size kas and PCD f-number NPCD. Dashed and solid lines indicate kas values resulting in ratios ±1 or ±3 dB, respectively. (b) Corresponding pressure ratios and contours for a polystyrene sphere. (c) Minimum kas values exceeding pressure ratios of ±1 dB (solid line) and ±3 dB (dashed line) for a silica sphere, as a function of NPCD. Dotted lines indicate kas values corresponding to scatterer diameters 1, 1/2, and 1/4 the corresponding −6 dB PCD beamwidth. (d) Corresponding plots for a polystyrene sphere.
