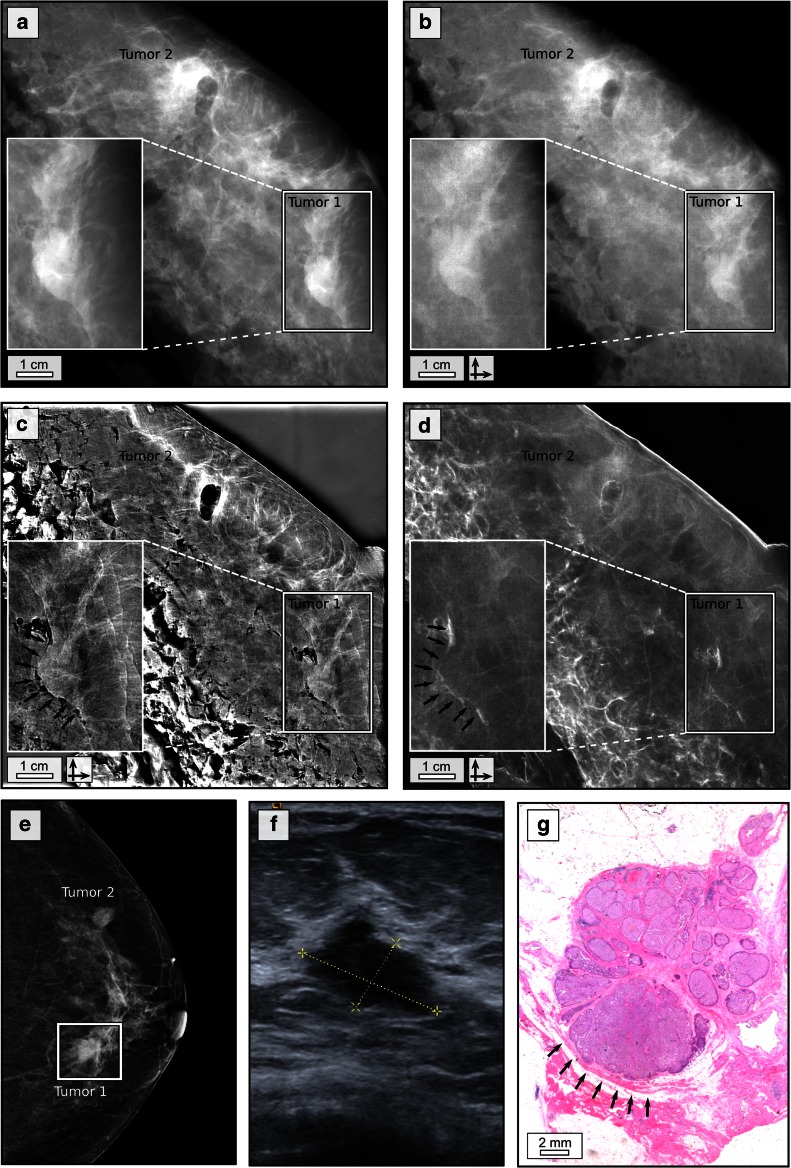
Fig. 3.
Phase-contrast and dark-field mammography reveal tumour margins. Clinical ex vivo mammography in craniocaudal (cc) projection at 27 kVp, 120 mAs and 1.18 mGy average glandular dose (rhodium filter) (a), experimental absorption-contrast mammography (b), phase-contrast mammography (c) and dark-field mammography (d) at 40 kVp, 70 mA and 70 mGy mean glandular dose (per scan direction); in vivo mammography in cc projection at 29 kVp, 125 mAs and 1.26 mGy average glandular dose (rhodium filter) (e) of patient 3 in craniocaudal projection; white rectangle indicating tumour 1; ultrasound of tumour 1 (f); histological image (haematoxylin–eosin staining) of tumour 1 (g); the posterior margin of tumour 1 is indicated by black arrows in c, d and g. The crossed arrows in b–d indicate bidirectional measurements

