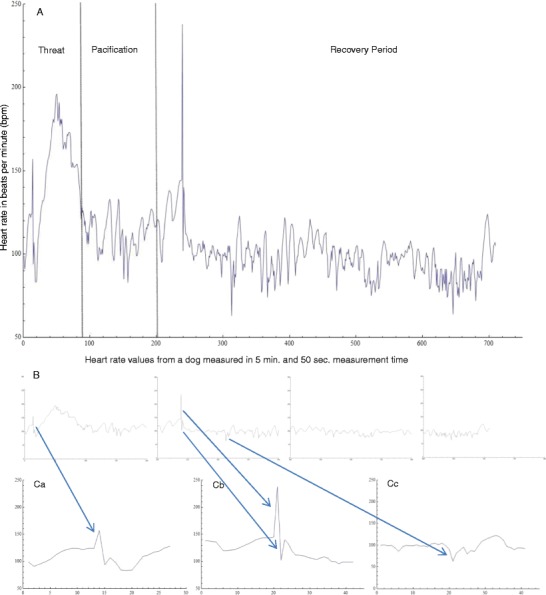
Fig. 1.

Graphical representation of heart rate (HR) values for visual inspection of a data set. (A) Dog HR from one complete threat situation, including the pacification and 5-min recovery periods. (B) Parts of Graph A, divided into blocks of 200 data points. (C) a. Value 14 (157 bpm) was identified as an error by the algorithm. b. Values 239 (238 bpm) and 240 (102 bpm) were deleted as errors after visual inspection, because of their clear discontinuity with the preceding and following values. c. Value 313 (63 bpm) was identified as an error by the algorithm
