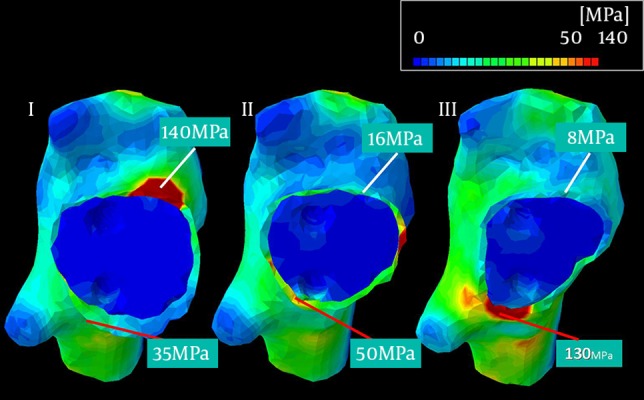
Figure 2. Viewed From the Top After Removal of the Femoral Head, Showing the Von Mises Stress Distribution.

The peak stresses at the medial cortex (red lines) were 35, 50 and 130 MPa in Pauwels type I, II, and III fractures, respectively.

The peak stresses at the medial cortex (red lines) were 35, 50 and 130 MPa in Pauwels type I, II, and III fractures, respectively.