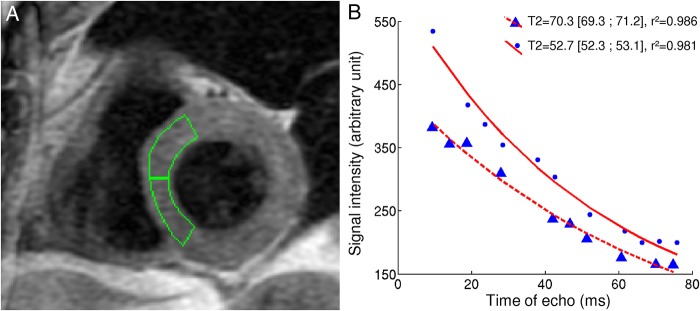
Figure 2.
Illustration of our method to quantify myocardial T2. (A) Example of the positioning of the regions of interest for both septal segments. In this example, the physician chose to avoid the border of the myocardium to avoid error due to imperfect registration between the 10 images. (B) Examples of exponential fits for normal and high T2. Both curves comprise 10 points corresponding to the signal intensity within a given septal region of interest for each image acquired with 10 different echo times. Myocardium with higher T2 needs more time to decrease its signal intensity.

