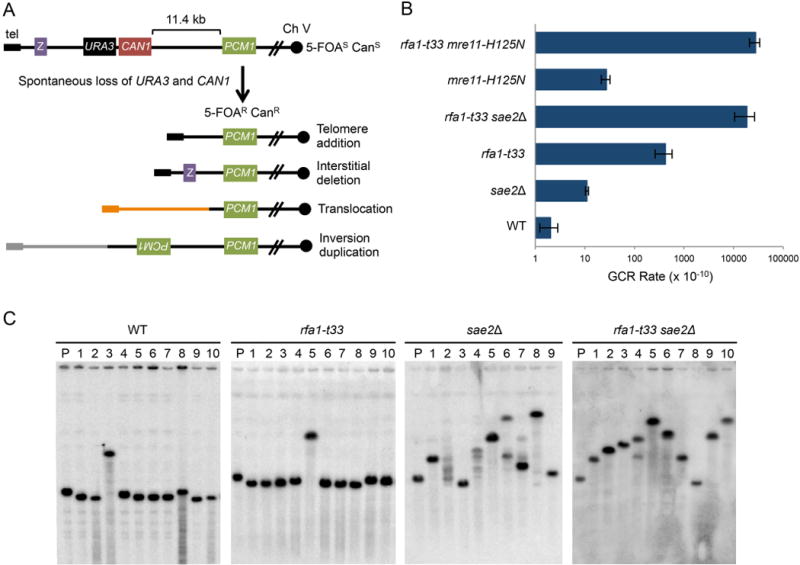
Figure 1. Increased GCR rate and an altered spectrum of events in sae2Δ derivatives.

A. Schematic of the GCR assay and rearrangements. Z indicates a distal Ch V gene that would be retained after interstitial deletion and the solid circle denote the centromere. B. GCR rates for the indicated genotypes, WT denotes wild type. The rates shown are the average of three independent trials for WT, sae2Δ, mre11-H125N, rfa1-t33 mre11-H125N and five and seven-independent trials for rfa1-t33 and rfa1-t33 sae2Δ, respectively. Error bars indicate standard deviation. C. PFGE of WT, rfa1-t33, sae2Δ and rfa1-t33 sae2Δ GCR clones. The first lane of each blot (P) shows the parental un-rearranged Ch V. See also Figure S1.
