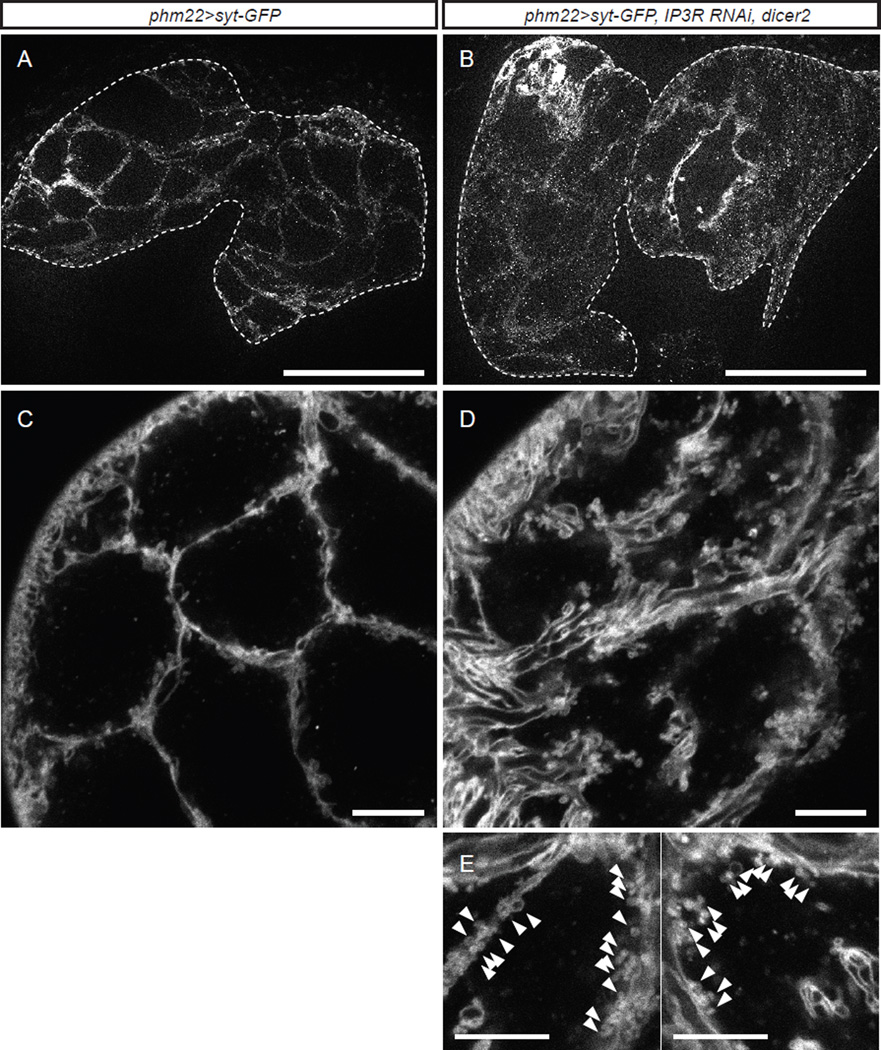
Figure 3. Syt-GFP Reveals the Presence of Vesicle-Like Structures in the PG.
(A) Representative image of the PG from a wandering control larva overexpressing Syt-GFP (phm22>Syt-GFP). The PG is surrounded by a dashed line. Scale bar, 100 µm.
(B) Representative image of the PG from a day 7 (~150 h AEL) IP3R RNAi larva overexpressing Syt-GFP (phm22>Syt-GFP, IP3R RNAi, dicer2). The PG is surrounded by a dashed line. Scale bar, 100 µm.
(C) Confocal image of the PG from a wandering control larva overexpressing Syt-GFP. Scale bar, 10 µm.
(D) Confocal image of the PG from a day 7 (~150 h AEL) IP3R RNAi larva overexpressing Syt-GFP. Scale bar, 10 µm.
(E) Magnified view of the PG cells from day7 (~150 h AEL) IP3R RNAi larvae overexpressing Syt-GPF. Note aggregation of many small vesicle-like structures along the membrane (arrowheads). Scale bars, 10 µm.

