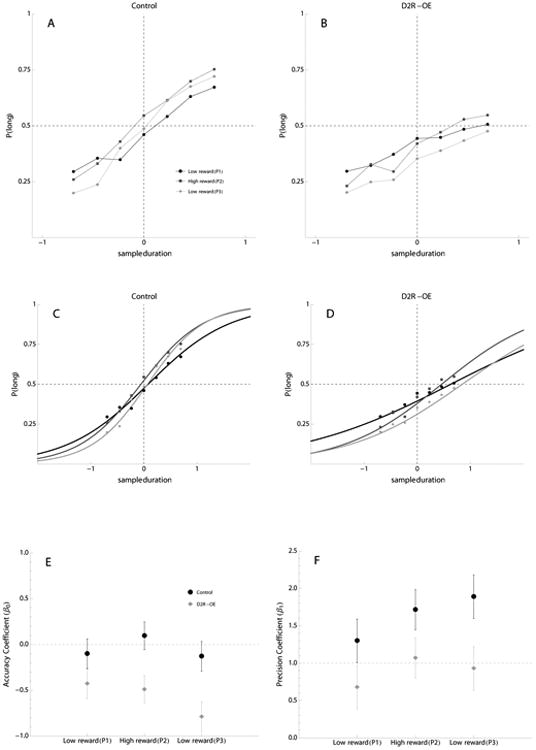
Figure 2.

Performance of Control and D2R-OE Mice in the Temporal Bisection Task with Changes in Reward Magnitude.
The top row of graphs show mean proportion of responses to the lever associated with the ‘long’ sample duration as a function of sample duration (seconds) in 3 phases (phase1-low reward = black circles and lines, phase2-high reward = dark gray squares and lines, and phase3-low reward = light gray diamonds and lines). A) Control mice, B) D2R-OE mice. The middle row of graphs show data fit by binomial logistic regression superimposed with the mean proportion of long responses per sample duration for C) Control mice and D) D2R-OE mice in each phase (Same phase symbols as A and B). The lower row of graphs show model coefficients for each group after addition of fixed effect estimates: E) the accuracy coefficient (β0±SE), F) the slope coefficient (β1±SE). Control = black circles, D2R-OE= gray diamonds. Note that SE is based on the between subject variability, the statistical results in the text are based on a within subject analysis.
