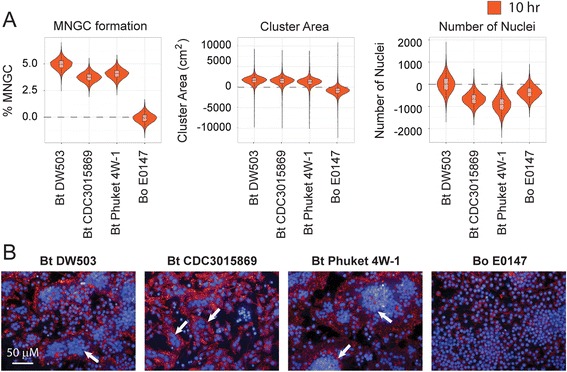
Fig. 2.

Quantitation of Bt and Bo induced MNGC formation. RAW264.7 macrophages were infected with indicated Bt and Bo strains at a MOI of 30. Ten hours post infection cells were fixed and stained with hoechst dye and phalloidin-568. a) Violin plots representing the quantitation of cellular attributes of the cluster population (i.e.: MNGC formation, Cluster Area and number of nuclei) as measured by MNGC image analyses procedure. All data was normalized to uninfected control. b) Representative confocal images of MNGC formation. Nuclei are pseudocolored blue (hoechst dye) and actin pseudocolored red (Phalloidin). Scale bar - 50 μm. All data shown is representative of six replicates per plate, three plates per day and performed on three independent days. White arrows indicate MNGCs
