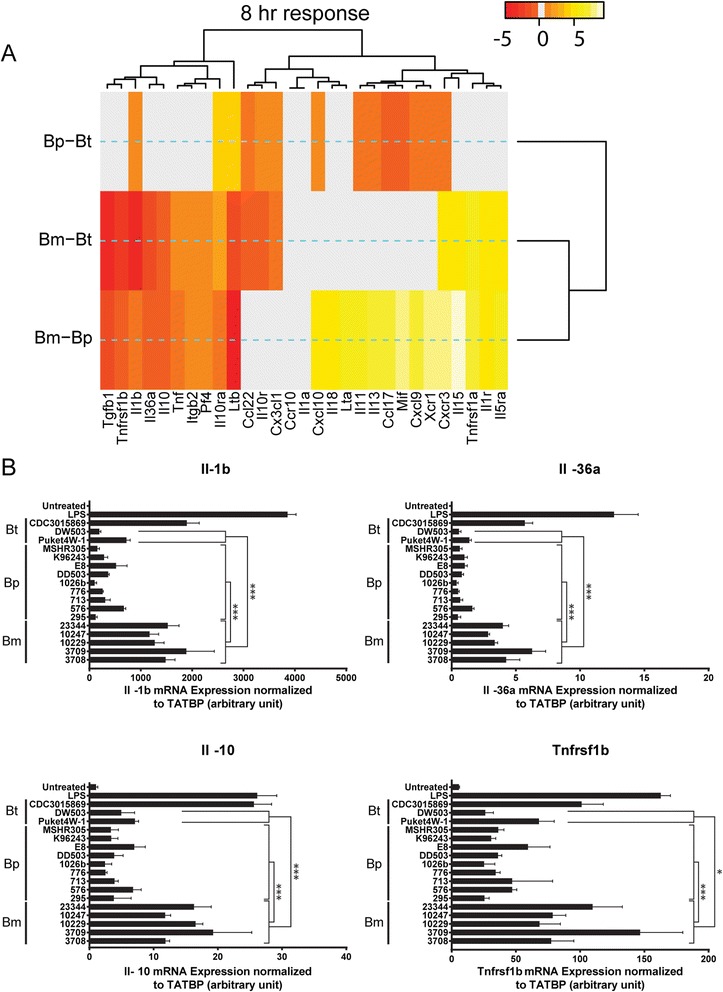
Fig. 7.

Heat map of pairwise differential gene expression and validation a) Heat maps are colored spectrally to indicate strength of statistical significance for pairwise comparisons. Spectral colors range from red (negative) to yellow (positive) for the t-statistic of each Student’s t-tests. Gray regions indicate absence of statistically significant differences in gene expression. Data for the 8 h time post infection is shown. b) mRNA was extracted from independently prepared RAW264.7 macrophages infected with Burkholderia spp. for eight hours. mRNA was reverse transcribed to cDNA and the expression levels of indicated genes were quantified by real-time PCR. (* and *** represent p value smaller than 0.05 and 0.001, respectively). The data is average of three independent experiments
