Fig. 2.

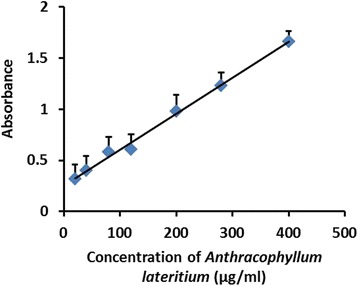
Ferric ion reducing power assay for MEFCA. The absorbance (A700) was plotted against concentration of the sample. The graphical data are represented as mean ± SD of three independent experiments

Ferric ion reducing power assay for MEFCA. The absorbance (A700) was plotted against concentration of the sample. The graphical data are represented as mean ± SD of three independent experiments