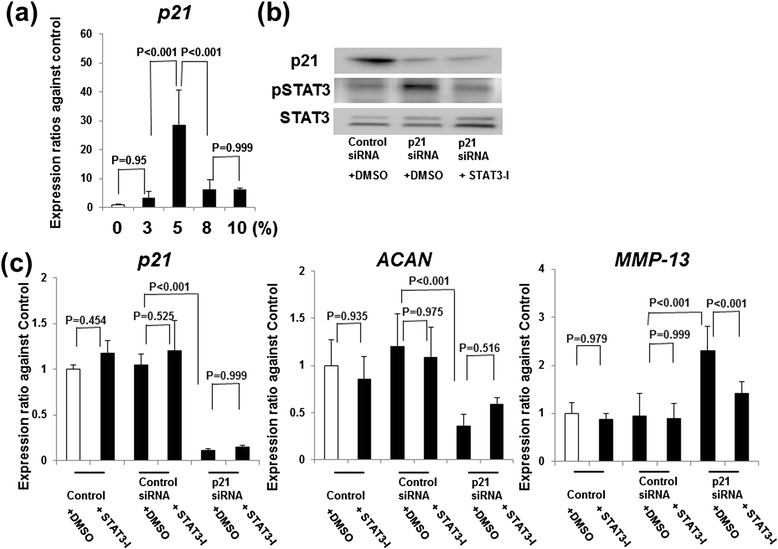
Fig. 1.

Expression of p21, ACAN, and MMP-13 without and with STAT3 inhibitor. a Expression levels of p21 mRNA were quantified by real-time PCR. Expression ratios of p21 are shown. Columns represent mean ratios with 95 % CI at 3, 5, 8, and 10 % strain/nonstrain control. b p21 and phospho-STAT3 were analyzed by Western blotting. The results shown represent three independent experiments. c The effect of a STAT3-specific inhibitor on p21-regulated ACAN and MMP-13 expression. Chondrocytes were transfected with p21 siRNA or nonspecific control siRNA for 12 h, and 5 % cyclic stretch stress was introduced for 3 h in the presence of 50 μM DMSO or STAT3-specific inhibitor. Expression levels of p21, ACAN, and MMP13 mRNAs were quantified by real-time PCR. Expression ratios of ACAN and MMP13 are shown. Columns represent mean ratios with 95 % CI against untreated control. The results shown are the average of four individual experiments. Values are normalized to GAPDH expression. ACAN aggrecan, CI confidence interval, DMSO dimethyl sulfoxide, MMP matrix metalloproteinase, PCR polymerase chain reaction, siRNA small interfering RNA, STAT3-I signal transducer and activator of transcription 3–specific inhibitor
