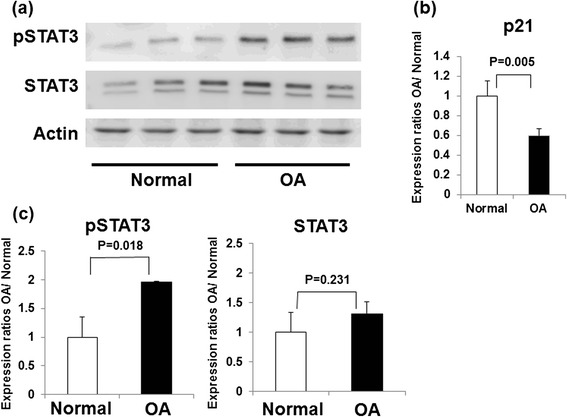
Fig. 6.

Differential expression of p21, STAT3, and p-STAT3 in normal and OA chondrocytes. a Expression of p-STAT3 and total STAT3 in normal (three samples) and OA (three samples) primary chondrocytes analyzed by Western blotting. b Columns represent the ratios of protein expression levels (p-STAT3/actin, STAT3/actin) determined by semiquantification of the digitally captured image. The results shown are the averages of three individual samples. c Expression levels of p21 mRNA levels were quantified by real-time PCR. Expression ratios of p21 are shown. Columns represent mean ratios with 95 % CIs of primary OA chondrocytes/primary normal chondrocytes. The results shown are the averages of five individual samples. Values are normalized to GAPDH expression. CI confidence interval, OA osteoarthritis, p-STAT3 phosphorylated signal transducer and activator of transcription 3, STAT3 signal transducer and activator of transcription 3
