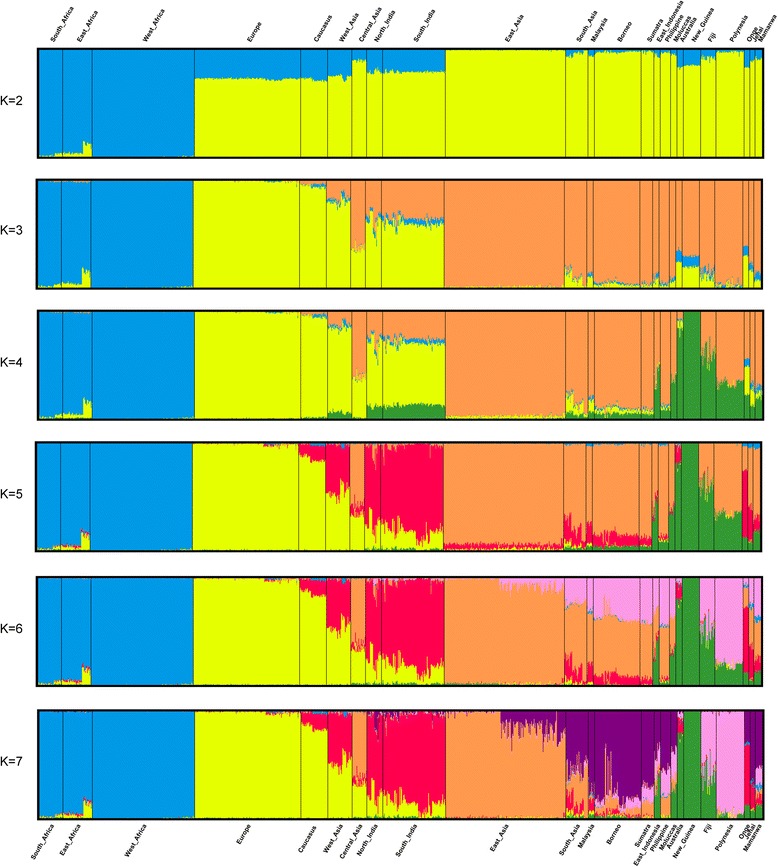
Fig. 3.

ADMIXTURE analysis of 1130 individuals in 24 populations from Africa, Eurasia, and Western Oceania. Each individual genotype is represented by a vertical column, the colors of which correspond to the inferred genetic contributions from k putative ancestral populations. The analysis was run for 2 ≤ k ≤ 7
