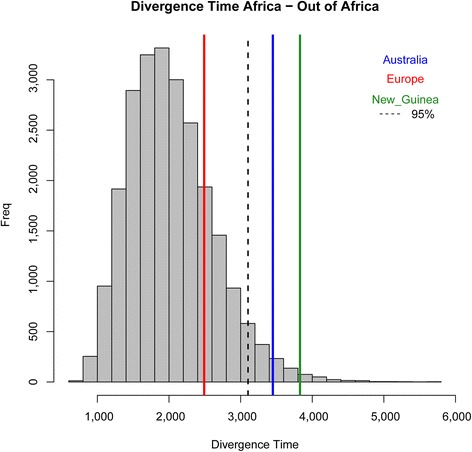
Fig. 4.

Comparison of three observed divergence times with the distribution of 24,000 divergence times between East African and non-African populations generated by simulation of a SD model. Data generated for 24 combinations of effective population sizes (3000 ≤ N e ≤ 8000) and divergence times (40K years ago ≤ T ≤ 70K years ago), 1000 independent datasets for each such combination. At every iteration, genetic variation at 1 Mb was considered in 100 chromosomes per population, thus analyzing 200,000 Mb for each parameter combination (for a total of 4800 Gb in 24,000 iterations)
