Fig. 2.

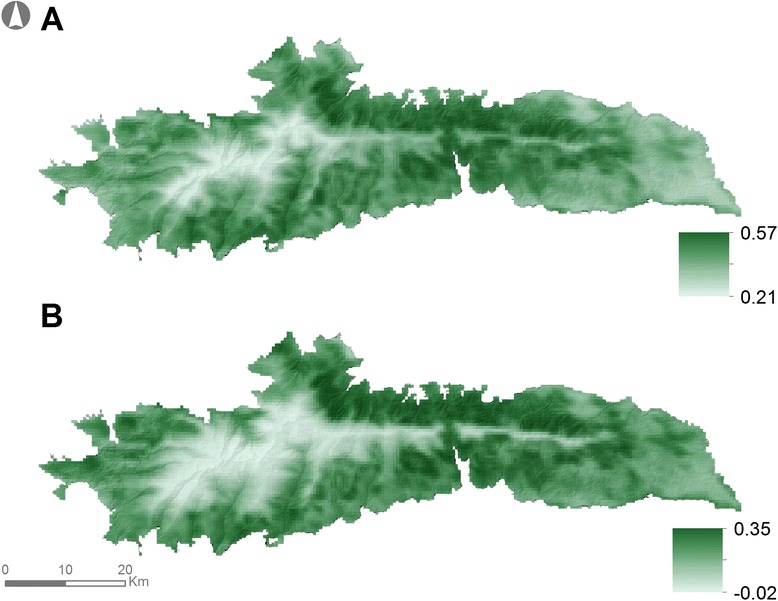
Spatial variability of NDVI during the (a) green (March – October) and (b) dormant (November – February) periods in SNNS. Pixel values in each map correspond to the pixel average for the relevant season for the period 2000–2008

Spatial variability of NDVI during the (a) green (March – October) and (b) dormant (November – February) periods in SNNS. Pixel values in each map correspond to the pixel average for the relevant season for the period 2000–2008