Fig. 3.

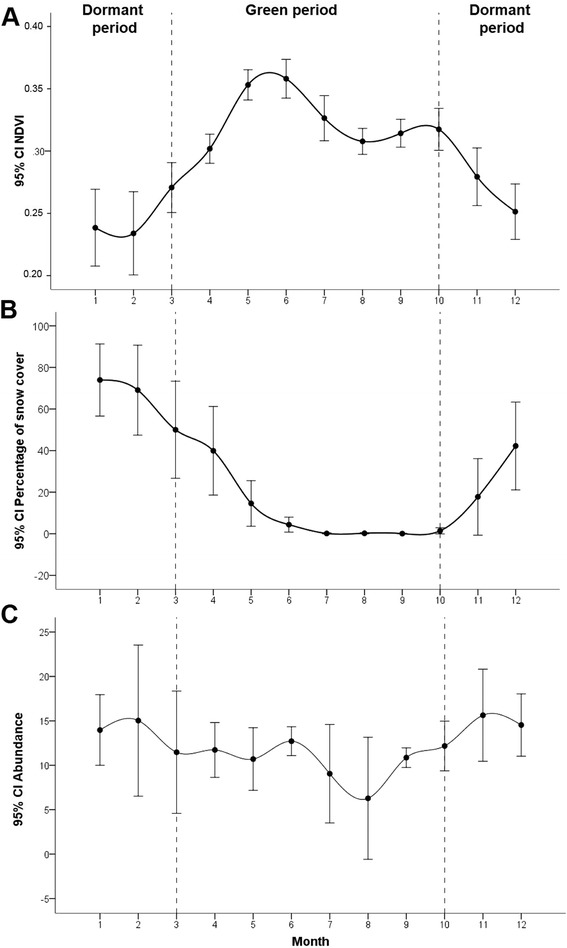
Intrannual variations of NDVI (a), snow cover (b) and number of ibexes observed (c) in SNNS. The error bars represent the inter-annual (1995–2008) fluctuations of variables values

Intrannual variations of NDVI (a), snow cover (b) and number of ibexes observed (c) in SNNS. The error bars represent the inter-annual (1995–2008) fluctuations of variables values