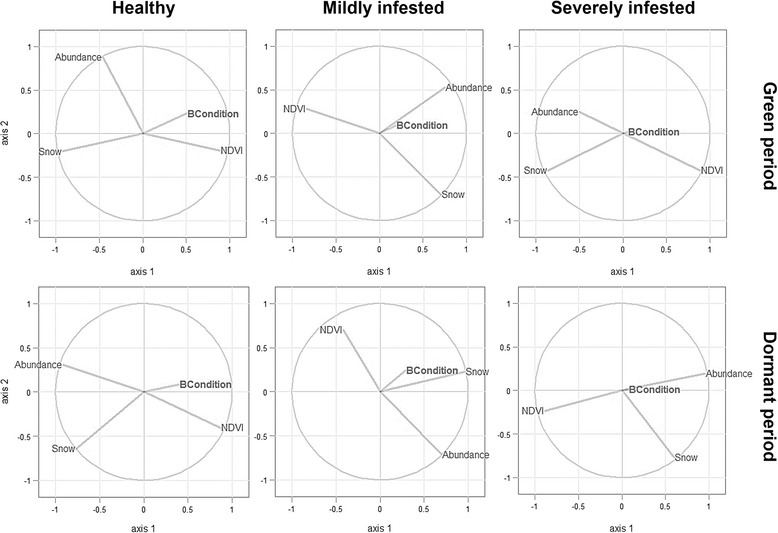
Fig. 5.

Correlation of the environmental predictors and the response with the first two components. Each segment represents a variable. Longer segments, i.e. closer to the perimeter of the circle, indicate that the corresponding variable is better represented. Segments close to each other represent highly and positively correlated variables. On the other hand, segments in opposite extremes indicate negative correlation. Orthogonal segments mean no correlation among predictors
