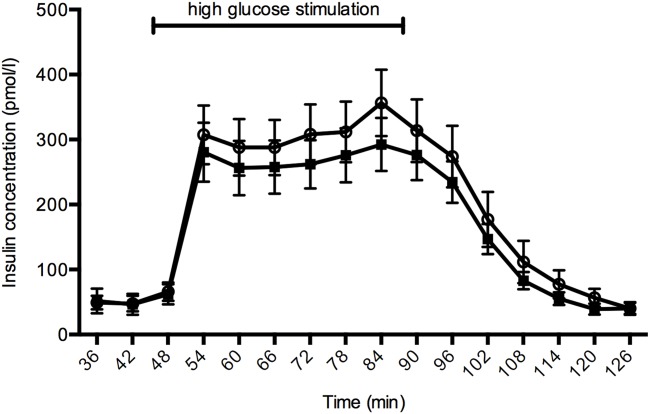
Figure 1.

Insulin secreting function during glucose perifusion of autoantibody-positive islets (black squares, n = 27) and control islets (white circles, n = 31). There was no statistically significant difference in the area under the curve between the groups (P = 0·50). Error bars show the standard error of mean (s.e.m.).
