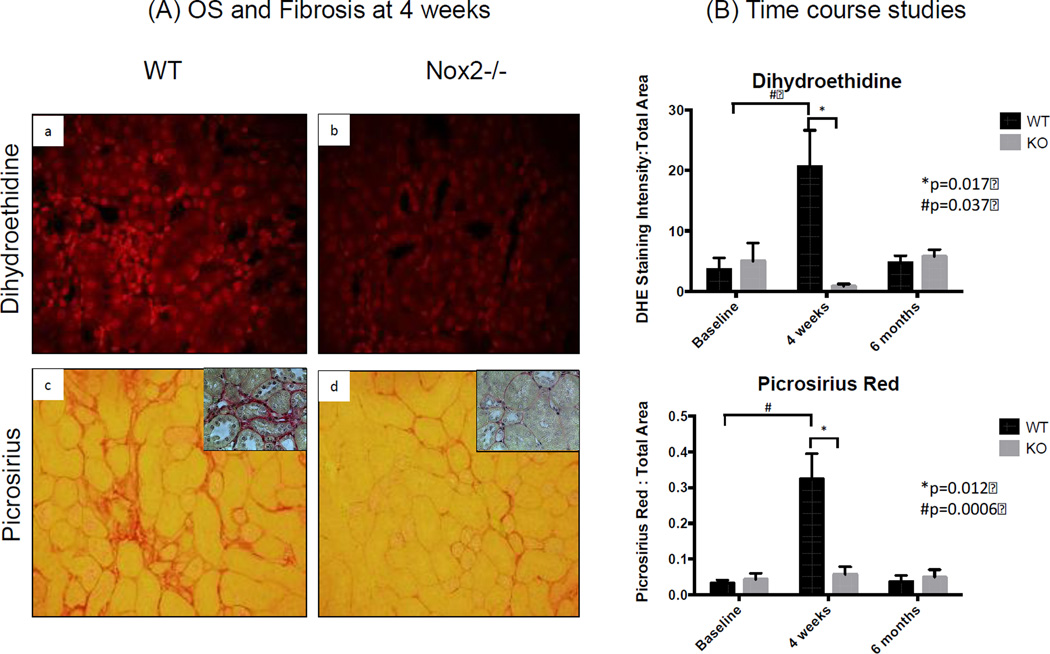
Figure 3.
Nuclear ROS and interstitial fibrosis are increased after IRI. Semi-quantification of fluorescence intensity showed higher nuclear ROS 4 weeks after IRI compared to baseline. Similar findings were seen with Pircosirius Red staining (inserts show higher magnification). Nox −/− was associated with significant reduction in nuclear ROS and Fibrosis. The kidneys remarkably healed 6 months after IRI (n=3 for WT and KO at each time point). The Y axis in panel B is a ratio (no units) of pixels. Specifically, it represents the number of pixels for DHE staining divided by number of pixels in the total image.

