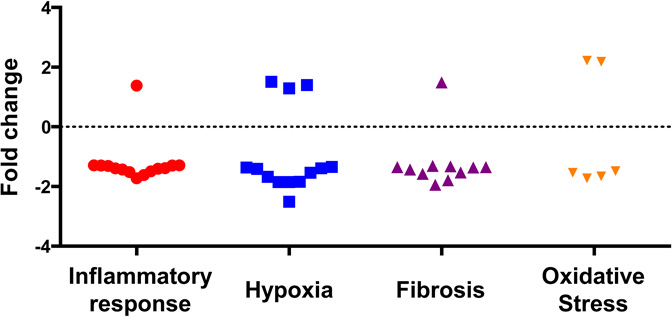
Table 2. Significant molecular changes in Nox2−/− vs. wild type mice after IRI.
Effects of Nox2 knockout on molecular signature of IRI. We identified 44 genes involved in fibrosis, oxidative stress, inflammation and response to hypoxia that appear to be associated with the Nox2 response to IRI. The majority of these genes were down-regulated.
| (a) Descriptive Table (alphabetical order) | |||||
|---|---|---|---|---|---|
| Gene symbol |
Fold change |
p | Gene symbol |
Fold change |
p |
| Inflammatory response (n=15) | Hypoxia (n=12) | ||||
| Axl | −1.38 | 0.021 | Bhlhe40 | −1.41 | 0.024 |
| Bcl3 | −1.40 | 0.026 | Cp | −1.84 | 0.044 |
| Ccl7 | −1.72 | 0.029 | Fgg | −1.68 | 0.012 |
| Ccr2 | −1.62 | 0.024 | Fos | −1.85 | 0.008 |
| Cfh | −1.54 | 0.035 | Itgb2 | −1.34 | 0.038 |
| Cxcl10 | −1.39 | 0.005 | Mmp14 | −1.85 | 0.014 |
| Cxcl3 | −1.43 | 0.031 | Ndrg1 | 1.51 | 0.014 |
| Ggt5 | −1.29 | 0.007 | Nt5e | 1.40 | 0.023 |
| Il34 | −1.30 | 0.032 | Plat | −1.39 | 0.041 |
| Itgb6 | 1.38 | 0.004 | Sox4 | −1.36 | 0.049 |
| Kit | −1.29 | 0.020 | Tfrc | 1.29 | 0.009 |
| Map3k1 | −1.31 | 0.043 | Vcam1 | −2.51 | 0.035 |
| Sdc1 | −1.30 | 0.047 | |||
| Tlr1 | −1.49 | 0.020 | |||
| Tlr6 | −1.52 | 0.024 | |||
| Fibrosis (n=11) | Oxidative Stress (n=6) | ||||
| Col1a1 | −1.79 | 0.026 | Akr1c18 | 2.18 | 0.009 |
| Col1a2 | −1.58 | 0.047 | Aldh1a1 | −1.48 | 0.024 |
| Col5a1 | −1.32 | 0.013 | Apoe | −1.66 | 0.012 |
| Ctgf | −1.31 | 0.038 | Car3 | 2.22 | 0.011 |
| Dcn | −1.43 | 0.046 | Cygb | −1.72 | 0.037 |
| Fn1 | −1.94 | 0.021 | Hspb1 | −1.54 | 0.039 |
| Itga4 | −1.35 | 0.035 | |||
| Mas1 | 1.49 | 0.002 | |||
| Spp1 | −1.53 | 0.041 | |||
| Trpv5 | −1.36 | 0.024 | |||
| Vav3 | −1.35 | 0.027 | |||
| (b) Upregulation and downregulation of genes after IRI in Nox2−/− compared to wild type mice |
|---|
 |
