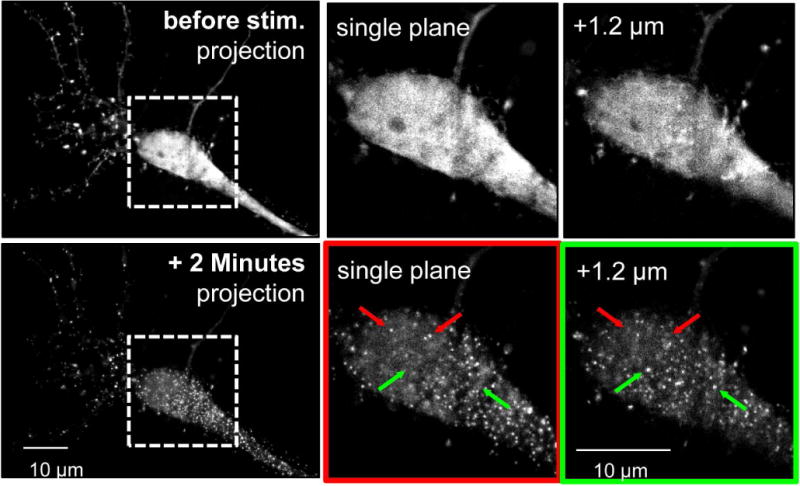
Fig. 4.

A FingR that enables live imaging of aggregation of endogenous CaMKII within neurons. Primary hippocampal neuron cultures were transfected with a CaMKII FingR at 12 DIV, allowing for visualization of endogenous CaMKII (at 13 DIV). (Top) Basally CaMKII is not aggregated in the soma, as seen in a representative neuron. Images of neurons were collected in z-stacks over 1.8 μm with 0.3 μm between planes. Somal puncta are not seen in a flattened image of all of the planes or in individual planes; top and bottom planes of the boxed in region are shown on the right. (Bottom) Aggregation is clearly seen 2 minutes after glutamate/glycine stimulation (stim.) in the same neuron depicted in the top panel. Arrows in the right panels identify puncta that are present in either the top plane (red) or the bottom plane (green) but not both. The presence of unique puncta in individual planes throughout the z-stacks shows that they are cytoplasmic rather than membrane associated.
