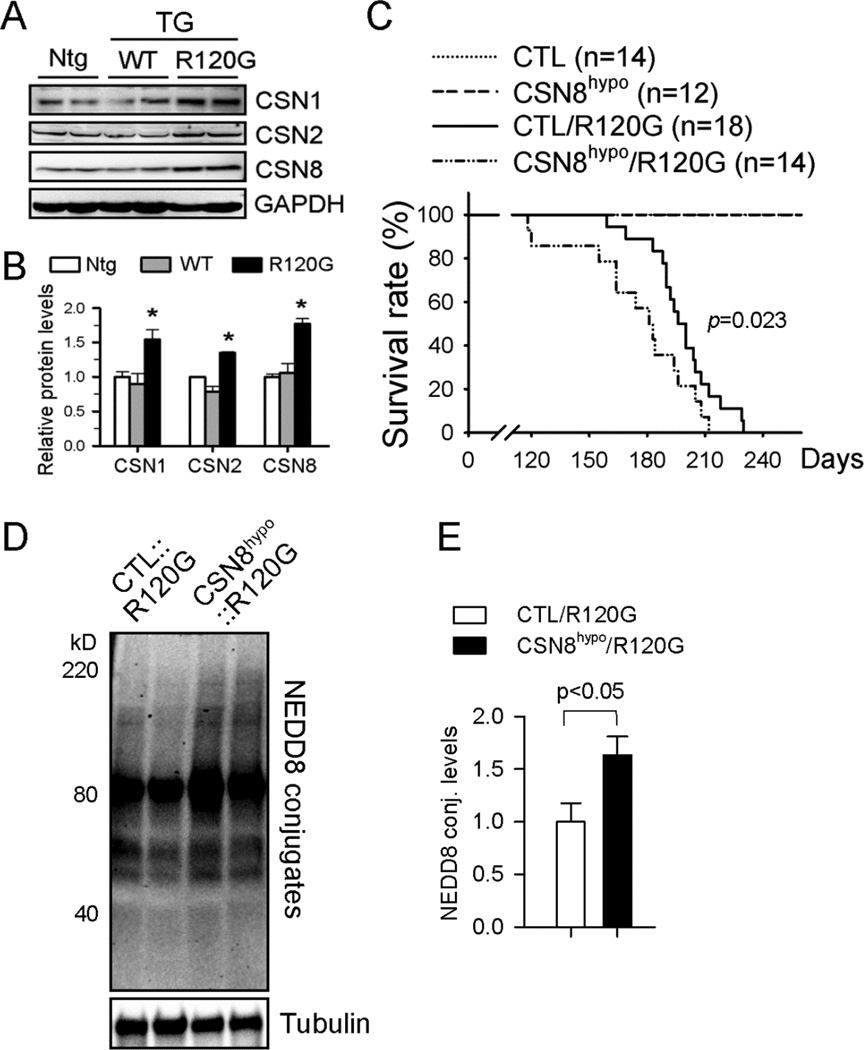
Figure 3. DRC exacerbation by CSN8hypo.
(A, B) Western blot analysis for the indicated CSN subunits in mouse hearts with tg overexpression of wild type CryAB (WT) or CryABR120G (R120G). Representative images (A) and pooled densitometry data (B) are shown. n=4 mice/group; *p<0.05 vs. Ntg or WT; ANOVA followed by the Scheffé test. (C) Kaplan-Meier survival analysis of a cohort of mixed-sex littermate CTL, CSN8hypo, CTL::CryABR120G, and CSN8hypo::CryABR120G mice. Log-rank test. (D, E) Representative image (D) and pooled densitometry data (E) of western blot analysis for myocardial NEDD8 conjugates (conj.) of mice of indicated genotypes at 8 weeks (n=4 mice/group); t-test.

