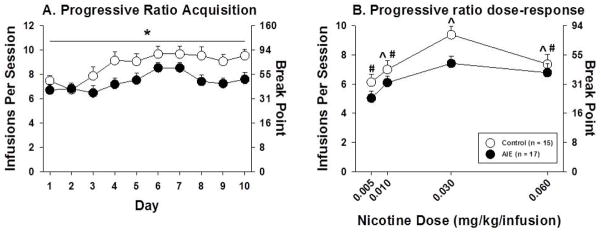
Figure 2.
Nicotine infusions self-administered under a PR schedule of reinforcement (left axis) and breakpoint (right axis) during acquisition (A) and across the dose-response function (B) in AIE-exposed and control rats. The asterisk denotes a significant main effect of AIE exposure in the ANOVA (p < .05). The carot denotes a significant difference from 0.005 mg/kg/infusion and the hash-mark denotes a significant difference from 0.030 mg/kg/infusion. The data are expressed as mean ± SEM.

