Figure 3.
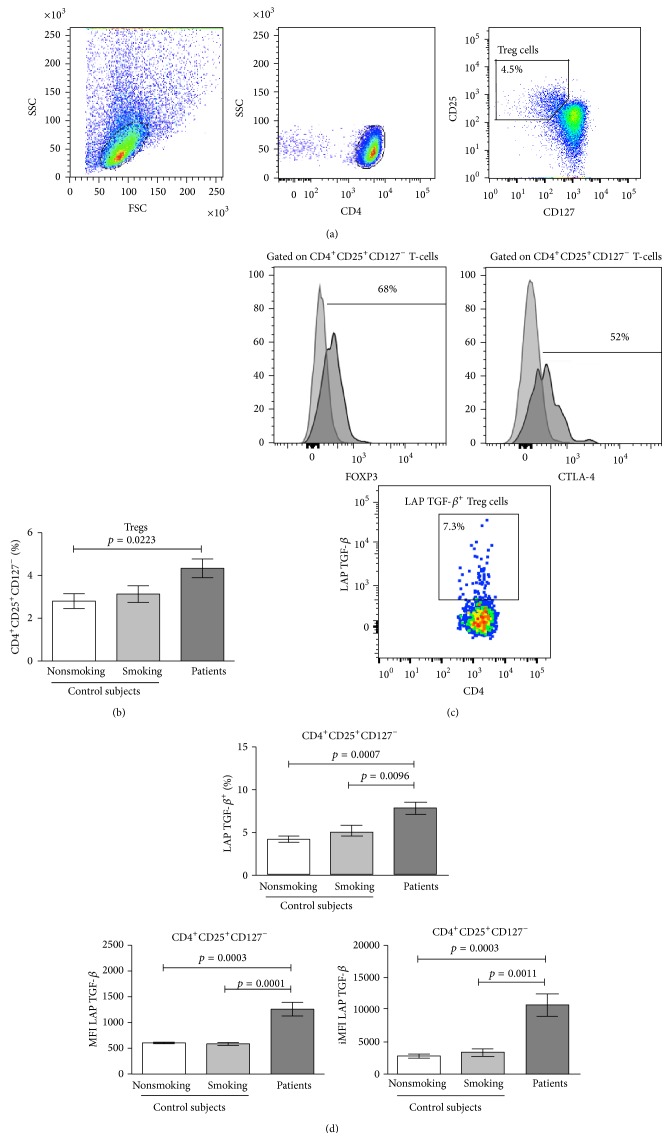
Percentages of Treg cells phenotyped as CD4+CD25+CD127− and percentages and expression levels of LAP TGF-β in Treg cells from lung adenocarcinoma patients and smoking and nonsmoking subjects. (a) Distribution of purified CD4+ T-cell in a forward scatter (FSC) and sideward scatter (SSC) dot plot. A gating was set for CD4+ T-cells. From gated CD4+ T-cells, the percentage of CD25+CD127− cells was detected. A representative cytometric analysis from a lung adenocarcinoma patient is shown. (b) Percentages of Treg cells from lung adenocarcinoma patients and smoking and nonsmoking control subjects are shown. The results are reported as mean ± SEM. (c) The histograms indicate the percentages of gated unstimulated Treg cells expressing FOXP3 or CTLA-4. From stimulated CD4+ T-cells, the percentage of LAP TGF-β + cells from Treg cells was detected. A representative cytometric analysis from a lung adenocarcinoma patient is shown. (d) Percentages and expression levels (measure by MFI and iMFI values) of LAP TGF-β from CD4+CD25+CD127− T-cells are shown and compared among the studied groups. The results are reported as mean ± SEM.

