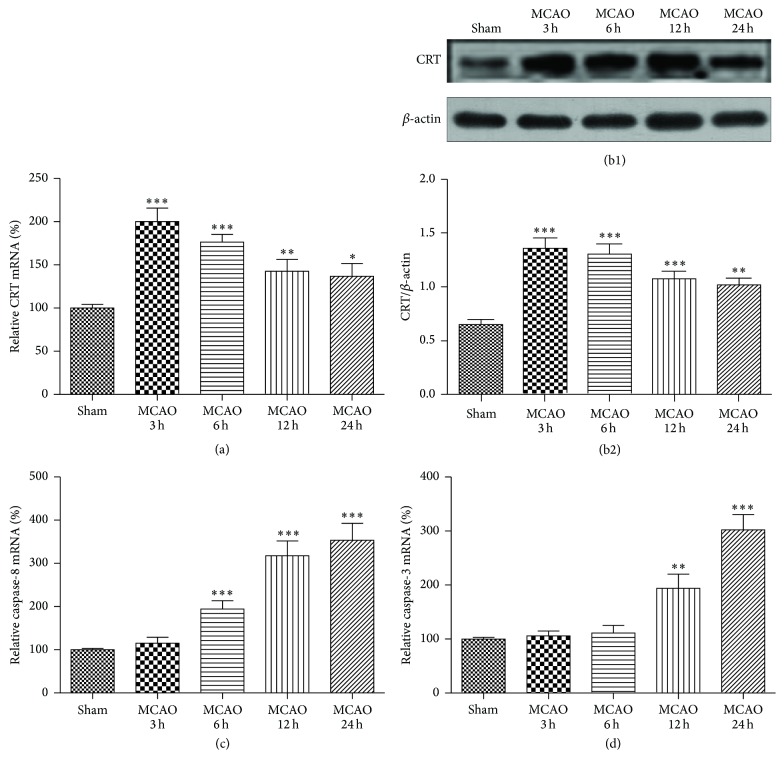
Figure 1.
Variation in CRT protein level and mRNA expression of CRT, caspase-8, and caspase-3 in the cortexes of MCAO mice. The ipsilateral cortexes of the sham and MCAO mice were collected at 3, 6, 12, and 24 h after reperfusion. (a) CRT mRNA expression detected by real-time PCR and (b1, 2) CRT protein levels detected by Western blotting. (c) Caspase-8 and (d) caspase-3 mRNA detected by real-time PCR. ∗ P < 0.05, ∗∗ P < 0.01, and ∗∗∗ P < 0.0001 versus sham. n = 6 repeats.

