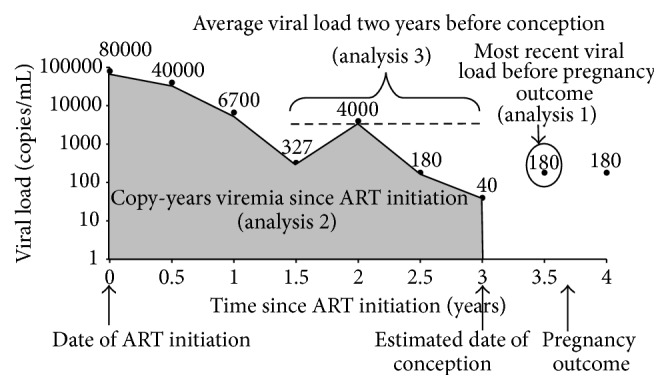
Figure 2.

Construction of copy-years viremia, a calculation of the area under the longitudinal viral load curve from ART initiation to estimated date of conception (analysis 2). Also illustrated in the figure are the average viral load two years before conception (analysis 3), equivalent to copy-years viremia in two years before conception, and the most recent viral load measure proximal to pregnancy outcome (analysis 1).
