Figure 5.
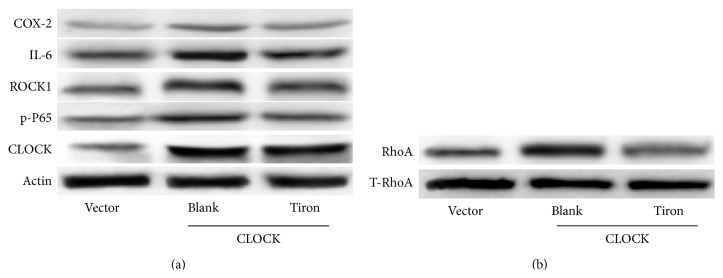
Effect of ROS levels on RhoA and NF-κB pathways. (a) Western blot analysis of RhoA pathway effector ROCK1 and NF-κB pathway effectors COX-2, IL-6, and p-P65 in HUVECs overexpressing hCLOCK and treated with either 10 μM Tiron or control solution for 12 hours. Vector control group consists of HUVECs transduced with control retroviral vector exposed to control solution. (b) Western blot analysis of activated RhoA normalized to total RhoA in HUVECs overexpressing hCLOCK and treated with either 10 μM Tiron or control solution for 12 hours. Vector control group consists of HUVECs transduced with control retroviral vector exposed to control solution.

