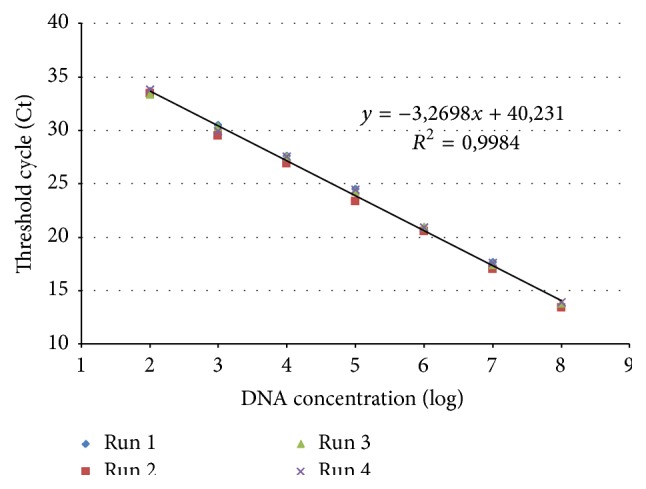
Figure 2.

DNA standard curve of CBPV RNA 2 RT-qPCR obtained with a 10-fold serial dilution (108 to 102 DNA copies per reaction) of 2,710 kb plasmid including the coding sequence of the predicted structural protein pSP on RNA 2-ORF3. Four independent runs were performed and allowed to obtain the linear regression analysis of the Ct measured for each amplification (y-axis) versus log10 of DNA concentration of each dilution (x-axis). The equation of the linear regression and the correlation coefficient (R 2) are indicated.
