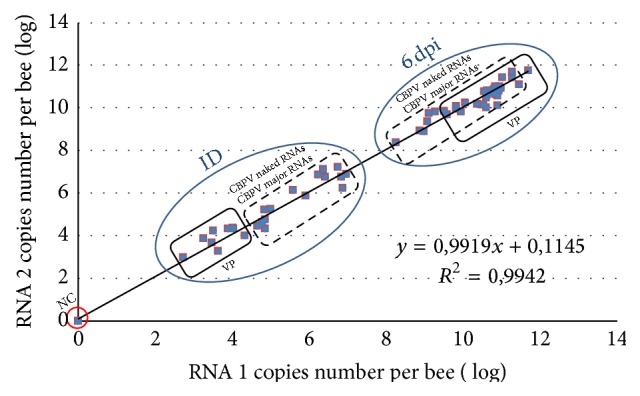
Figure 5.

Linear regression analysis of the results from RT-qPCR quantification of RNA 1 versus RNA2. The equation of the curve and the correlation coefficient are indicated. The results at inoculation day (ID) and those at 6 days post-inoculation (6 dpi) are represented in a blue circle. The RNA copies number of bees inoculated with CBPV viral particles (VP) is represented by a rectangle, bees inoculated with naked RNAs and major RNAs by dotted rectangle, and bees not inoculated as negative control (NC) by a red circle.
