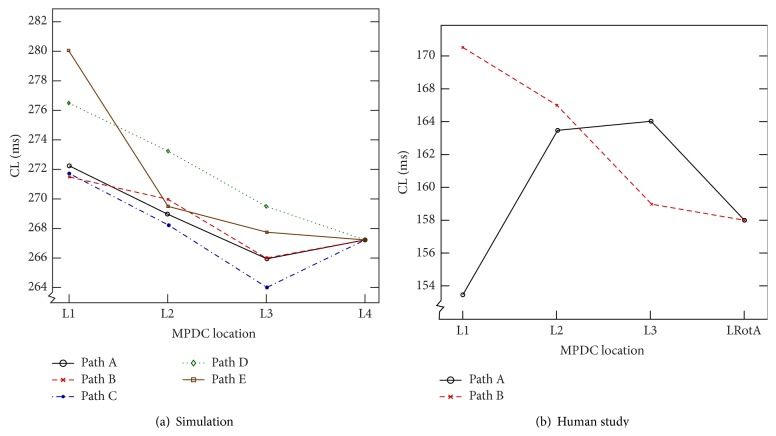
Figure 5.
Variation of average cycle length. Variation in average cycle length (CL) of the FAB with respect to the MPDC location: (a) In simulation study, the CL of Path D and Path E shows a decreasing gradient as the MPDC moves from L1 towards the RotA at L4. However, this decreasing gradient is not consistent in the other paths, where the CL decreases as the MPDC moves from L1 to L3 but increases at L4. (b) The plot demonstrates the inconsistent CL behavior observed in the clinical study. In Path A, the CL shows a decreasing gradient when the MPDC moves from L1 to LRotA, with the location of every successive step directed towards the FAB of the current location; however in Path B, the CL gradient is inconsistent; it increases as the MPDC moves from L1 to L3 with the location of every successive step directed towards the FAB of the current location, but it decreases at the location of RotA (i.e., LRotA).

