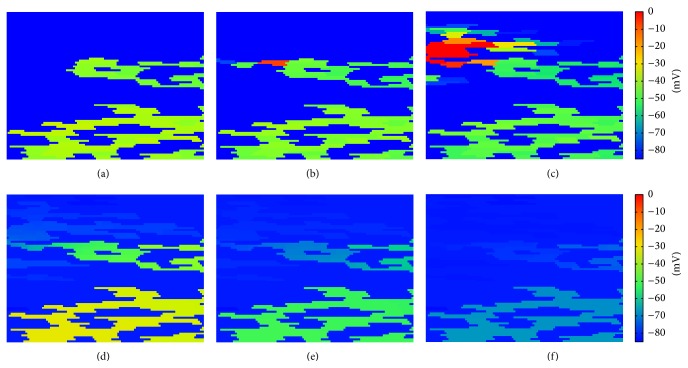
Figure 16.
Reentry in the microscopic model in comparison with the discrete model. Panels (a) (t = 75 ms), (b) (t = 80 ms), and (c) (t = 90 ms), successful reentry propagation (from right to left of the tissue) using the discrete model. Panels (d) (t = 75 ms), (e) (t = 80 ms), and (f) (t = 90 ms), reentry dies out using the microscopic model due to source-sink mismatch.

