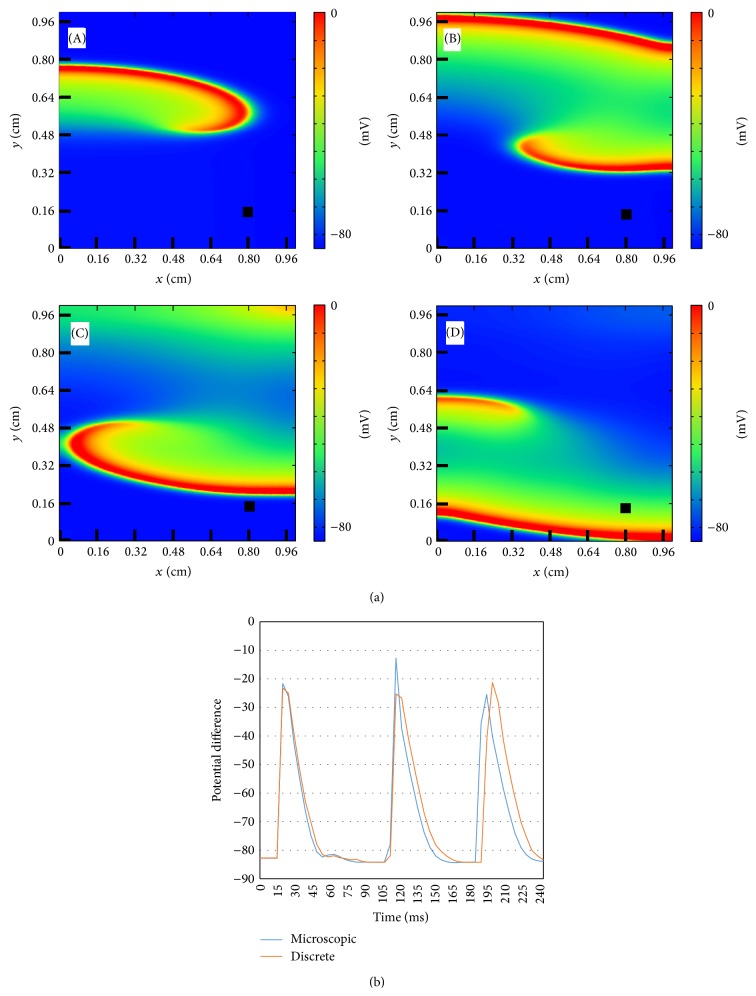
Figure 6.
Dynamics of the transmembrane potential showing a spiral wave generated by a S1-S2 protocol using the microscopic model. A sustained, single, and stable spiral wave is generated using a S1-S2 protocol. (a) Four snapshots showing the spiral rotation corresponding to times: t = 60 ms (A), t = 80 ms (B), t = 110 ms (C), and t = 120 ms (D). (b) Comparison of the time evolution of AP at a single point between the microscopic model (see previous panel) and the discrete model (not shown). The point is marked in the snapshots with a black square.

