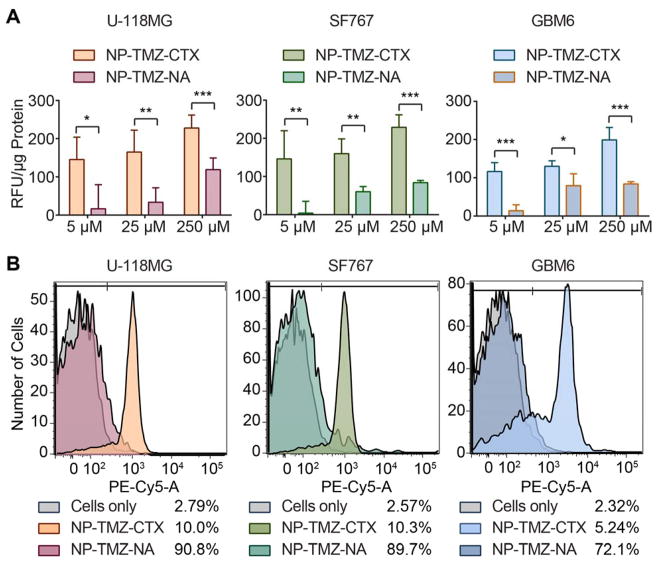
Figure 4.
Quantification of cellular uptake of NP-TMZ-CTX and NP-TMZ-NA. A) Quantification of NP uptake by microplate reader based on fluorescence intensity. B) Flow cytometry analysis of U-118 MG, SF767, and GBM6 cells treated with NPs. The percentages of positive cells are provided on the right side of legend. N.S. indicates not significant, * indicates P < 0.05, ** indicates P < 0.01, *** indicates P < 0.001, compared to NP-TMZ-NA as determined by Student’s t-test.

