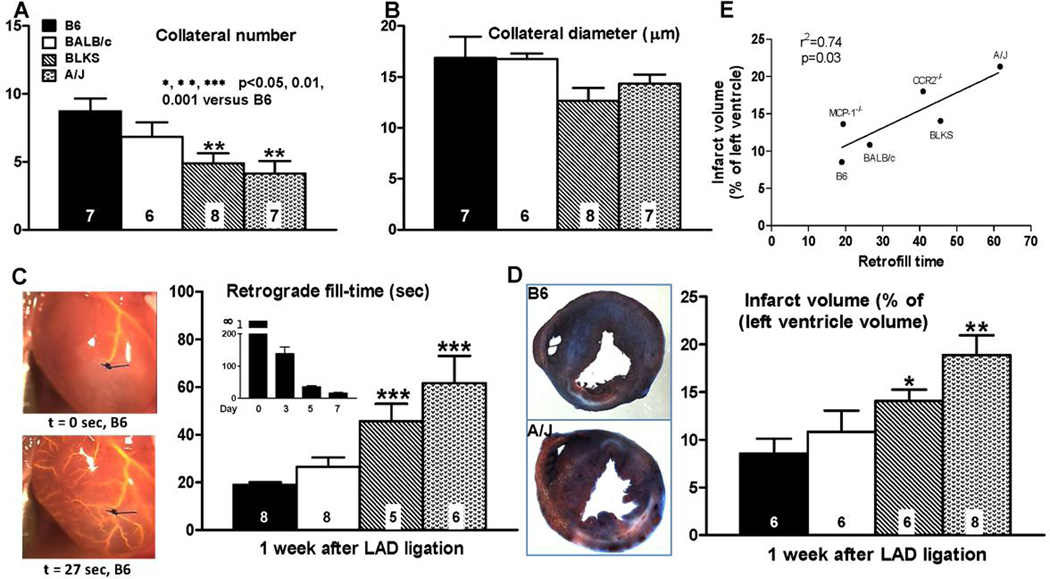
Figure 3. Formation of neo-collaterals after LAD ligation varies with genetic background (A,B) and correlates with relative conductance−1 of the newly-formed collateral network (C) and infarct volume (D).
A,B, Number and average diameter determined, as in Figure 2, one week after LADX. C, images on left, Time required from start of pump (0 sec) to achieve retrograde filling back to point of ligation of LAD (18 sec, B6 mouse, backfilled branches of LAD evident; See Online figure 10 for video); main bar graph, MicrofilR was at same viscosity and pressure for all strains; methods same as in Figure 1 but without optical clearing; insert bar graph, Fill-time on indicated days (n=10,9,4,8 mixed male and female B6 mice); no filling was seen at ≥ 5 min on day-0, consistent with no native collaterals (Figures 1,2), thus time labeled as “infinity” (∞). D, Infarct volume. E, Infarct volume correlated with retrograde fill-time; MCP-1−/− and CCR2−/− data points are associated with data in Figure 6. Key and statistics in A are for all panels; B6, C57BL/6; BLKS, C57BLKS. Data in panels A-D are from different mice.

