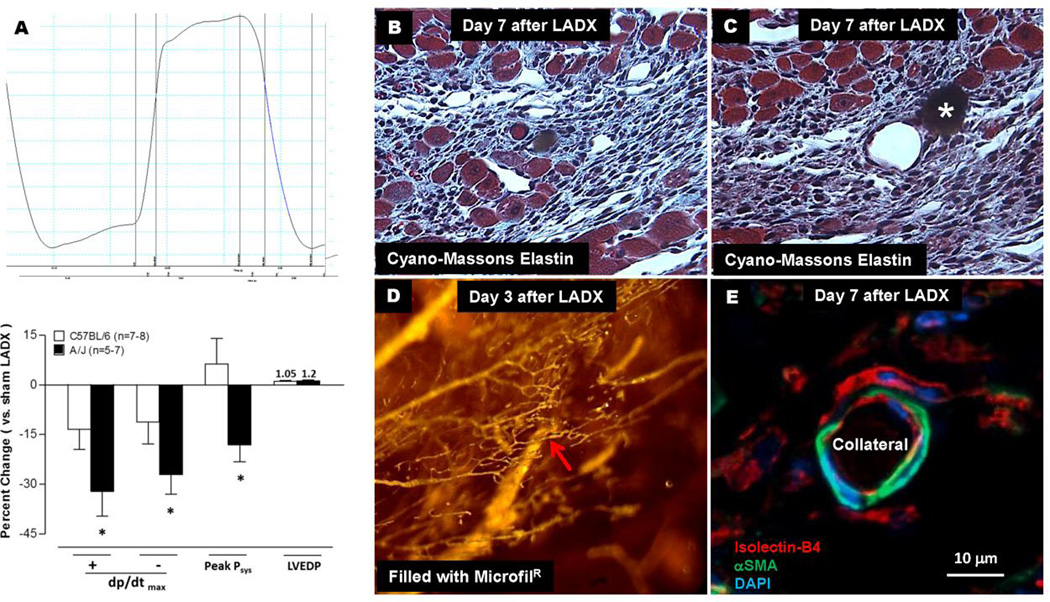
Figure 4. Less neo-collateral formation, less collateral network conductance and larger infarct volume in A/J strain versus B6 strain (see Figure 3) associated with greater deficit in ventricular function (A). Histology of neo-collaterals (B–E).
A, Left ventricular pressure over 1 cardiac cycle. Bottom panel, values determined 7 days after LAD ligation. B,C, Neo-collaterals (red arrows, 18 and 45 µm lumen diameter) with MicrofilR in lumen (B) or after floating out (C, star). Myocardial cells (large blue-red cells) evident near neo-collaterals and venules. D, Endocardial view of piece of ventricular wall bordering the infarct zone with neo-collateral (9 µm) indicated by red arrow. E, a-smooth muscle actin+ cells surrounding lectin+ endothelial cells of a neo-collateral 7 days after ligation; MicrofilR can be seen faintly in lumen in this and certain other figures in paper. See Online Figure 12 for methods. Data are representative of ≥ 3 mice at each time-point and each staining.

