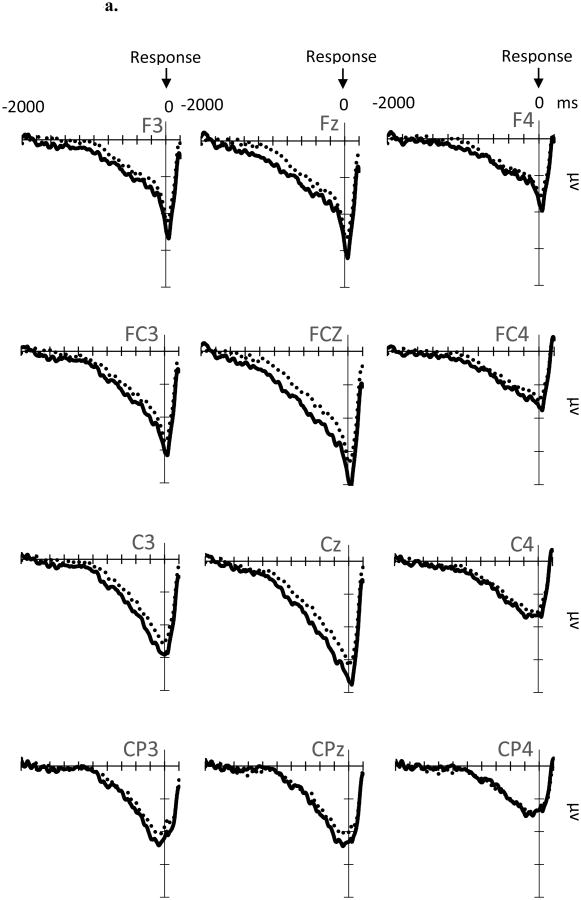
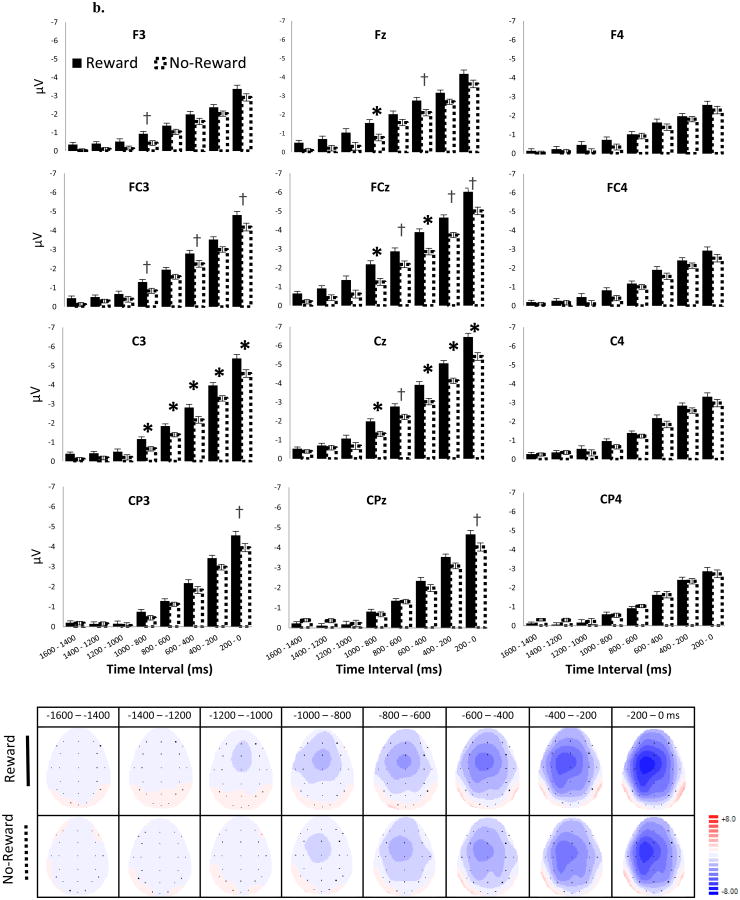
Figure 4.
ERP waveforms (4a), average amplitudes (4b, top) and topographical maps (4b, bottom) for the RP. RP amplitudes and topographical maps are measured at every 200-ms time window. Reward = Reward-Anticipation Cue. No-Reward = No-Reward-Anticipation Cue. Error bars represent ± standard error, corrected for repeated measurement. The time windows at which a simple effect of Anticipation-Cue Type are significant (p ≤ .05) and approaching significant (p ≤ .10) are indicated by asterisks (*) and crosses (†), respectively.


