Figure 8.

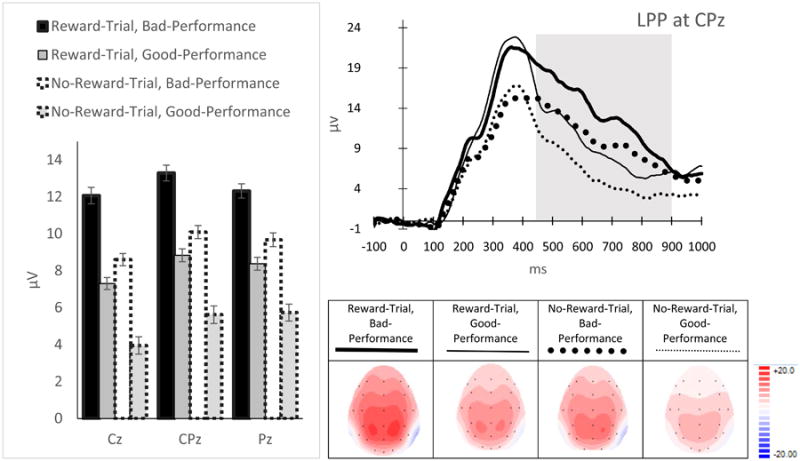
ERP magnitudes (left), waveforms (top-right) and topographical maps (bottom-right) for the LPP. The time windows used to measure the LPP are indicated in gray. Error bars represent ± standard error, corrected for repeated measurement.

ERP magnitudes (left), waveforms (top-right) and topographical maps (bottom-right) for the LPP. The time windows used to measure the LPP are indicated in gray. Error bars represent ± standard error, corrected for repeated measurement.