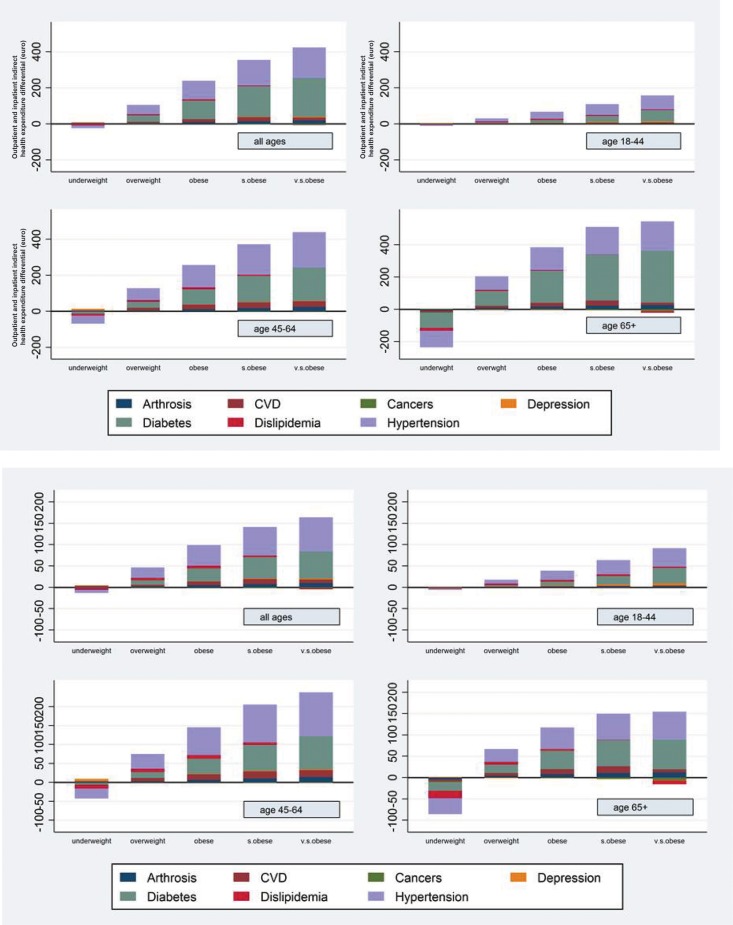
Figure 2. Total (a) and outpatient (b) indirect health care expenditure.
Decomposition of indirect health care expenditure by pathology, age group and BMI category compared to normo‐weight individuals (euro per year) for outpatient (b) and total (a) health expenditure. Note: Pathology specific indirect marginal effects for each BMI category were computed as the nonlinear combinations of parameters estimated within each pathology‐specific equation with the respective pathology‐specific parameter estimated within the health expenditure equation.

