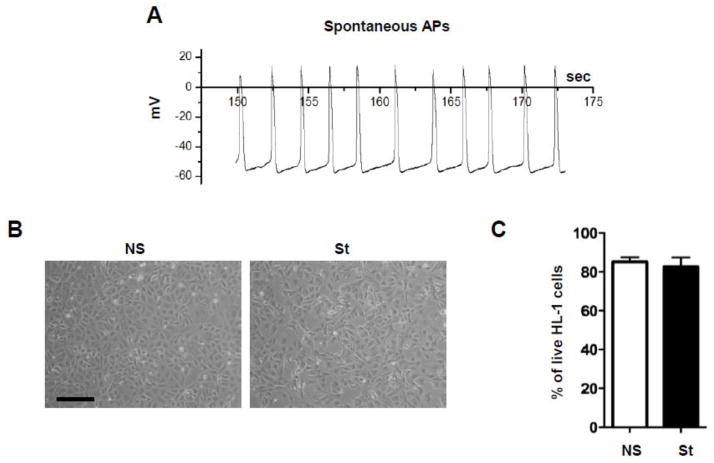
Fig. 1. Characteristics of cultured HL-1 cells.
(A) Spontaneous action potentials (APs) measured in single HL-1 cell. (B) Morphology of non-stimulated (NS) HL-1 cells and after 24 hours of electrical stimulation at 0.5 Hz (St). Scale bar = 100 μm. (C) Propidium Iodide (PI) staining on NS and St HL-1 cells did not reveal any change in cell viability after pacing (n=3). Data are presented as mean ± s.e.m, unpaired Student t-test: * p < 0.05.

