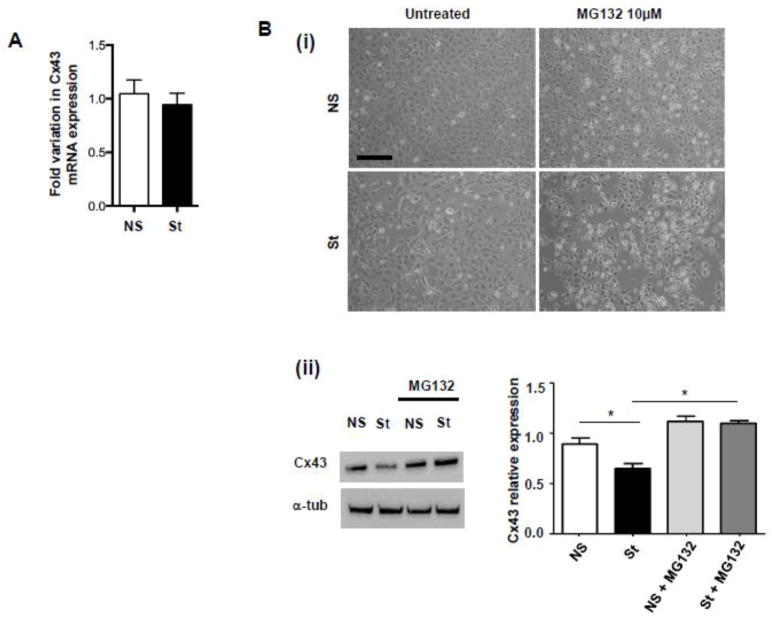
Fig. 5. Gene expression analysis of Cx43 and treatment with proteasome inhibitor MG132.
(A) Real Time RT-PCR for Cx43 mRNA expression in NS and St HL-1 cells (n=3). (B) (i) Representative pictures and (ii) Western Blot analysis of NS and St HL-1 treated with 10 μM of proteasome inhibitor MG132 (n=5). Data are presented as mean ± s.e.m, One-way ANOVA, followed by Bonferroni’s multiple comparison correction: * p < 0.05. Scale bar = 100 μm.

