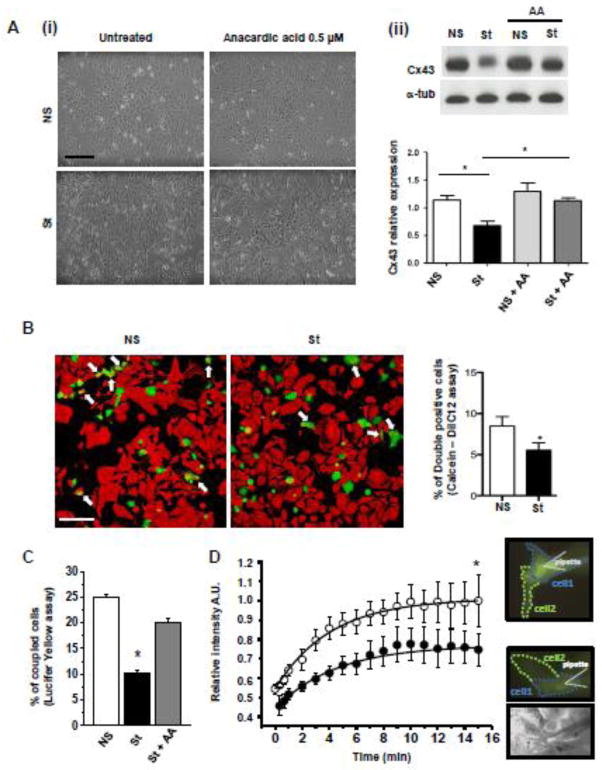
Fig. 6. Electrical stimulation leads to a reversible reduction in cell-cell communication.
(A) (i) Representative images and (ii) Western Blot analysis of NS and St HL-1 cells treated with 0.5 μM of HAT inhibitor Anacardic Acid AA (n=5). Data are presented as mean ± s.e.m, One-way ANOVA, followed by Bonferroni’s multiple comparison correction: * p < 0.05. Scale bar = 100 μm. (B) Representative confocal images showing reduced dye diffusion in St HL-1 cells compared with NS. White arrows indicate double positive cells (Calcein-AM+/DilC12+). The bar graph on the right shows the average number of double-positive cells per field (n=3 independent Calcein-DilC12 transfer experiments, counting cells in an average of 12 fields per experiment). Scale bar = 100 μm. (C) Bar graph representing the percentage of coupled cells receiving the Lucifer Yellow (LY) from the micro-injected donor cell (at least 23 cells from 4 independent experiments for each condition). (D) Time course of fluorescence relative intensity (A.U. = arbitrary units) averaged in a region of interest set to equal the area of the receiving cells. White and black dots represent the average time course in NS and St HL-1 cells, respectively (at least 46 cells from 10 independent experiments for each condition at different time points). On the right, fluorescence and transmission images of NS (top) and St (bottom) HL-1 clusters acquired 15 minutes after the pipette break-in.

