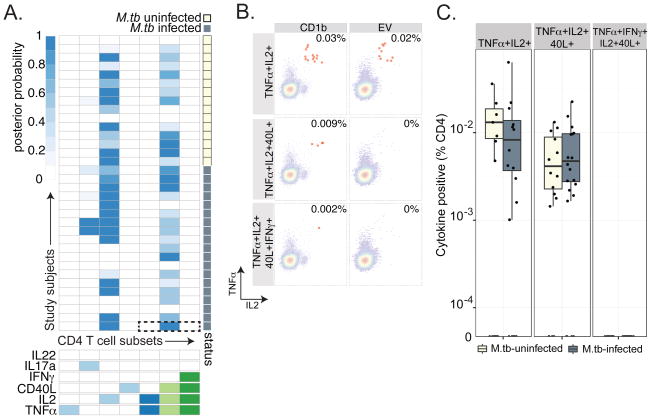
Figure 3. CD4 T-cell responses to mycolic acid.
(A) COMPASS analysis reveals T-cell responses are largely limited to two T cell subsets: IL-2 single producing cells and cells expressing IL-2, TNF-a, and CD40L. The dotted box outlines polyfunctional T-cell responses in an M.tb-infected subject that does not predict 2 or 4-function T cell subsets (B) Expanded view of polyfunctional T-cell responses in an M.tb-infected subject. Representative FACS plots in which CD4 T cells expressing two, three, or four functions in the presence of MA and K562 cells transfected with CD1B or empty vector (EV) are highlighted in red. High background within the TNFa+IL2+ subset decreases the probability of detecting a true response using COMPASS. (C) The magnitude of MA-specific CD4 T cells expressing two, three, and four functions are shown. There was no association with M.tb infection (p > 0.05 for TNFα+IL2+ and TNFα+IL2+CD40L+, no data for TNFα+IL2+CD40L+IFN-γ+).

