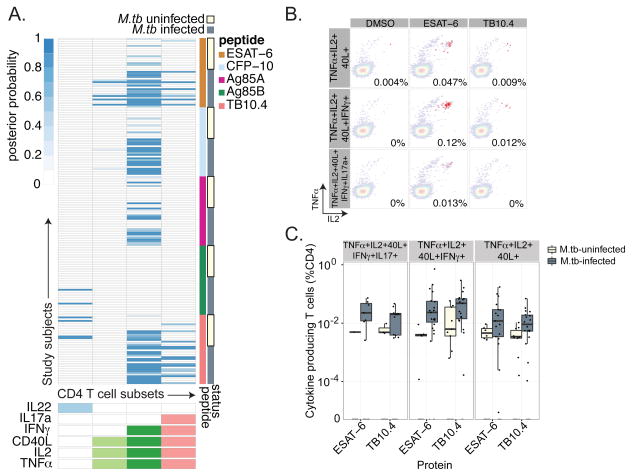
Figure 4. CD4 T-cell responses against secreted protein antigens are highly polyfunctional.
(A) Stacked COMPASS heatmaps displaying CD4 T-cell responses to five secreted proteins in M.tb-infected and M.tb-uninfected adolescents. In the heatmap, columns represent cytokine subsets and rows represent study subjects, as in Fig 2. The depth of shading represents the posterior probability of detecting responses to a given protein within a given individual. (B) Representative FACS plots showing CD4 T cells expressing three (TNFα+IL2+CD40L+), four (TNFα+IL2+CD40L+IFN-γ+), or five (TNFα+IL2+CD40L+IFN-γ+IL17a+) functions in the presence of DMSO or peptide pools against ESAT-6 or TB10.4. (C) The magnitude of CD4 T cells expressing three, four, and five functions are shown for ESAT-6 and TB10.4 stratified by M.tb infection status. There was a statistically significant increase in the magnitude of CD4 T-cell responses among M.tb infected subjects for both ESAT-6 and TB10.4 (TNFα+IL2+CD40L p<0.01, TNFα+IL2+CD40L+IFN-γ+ p<0.01, and TNFα+IL2+CD40L+IFN-γ+IL17a+ p<0.05 by Wilcoxon rank sums test).

