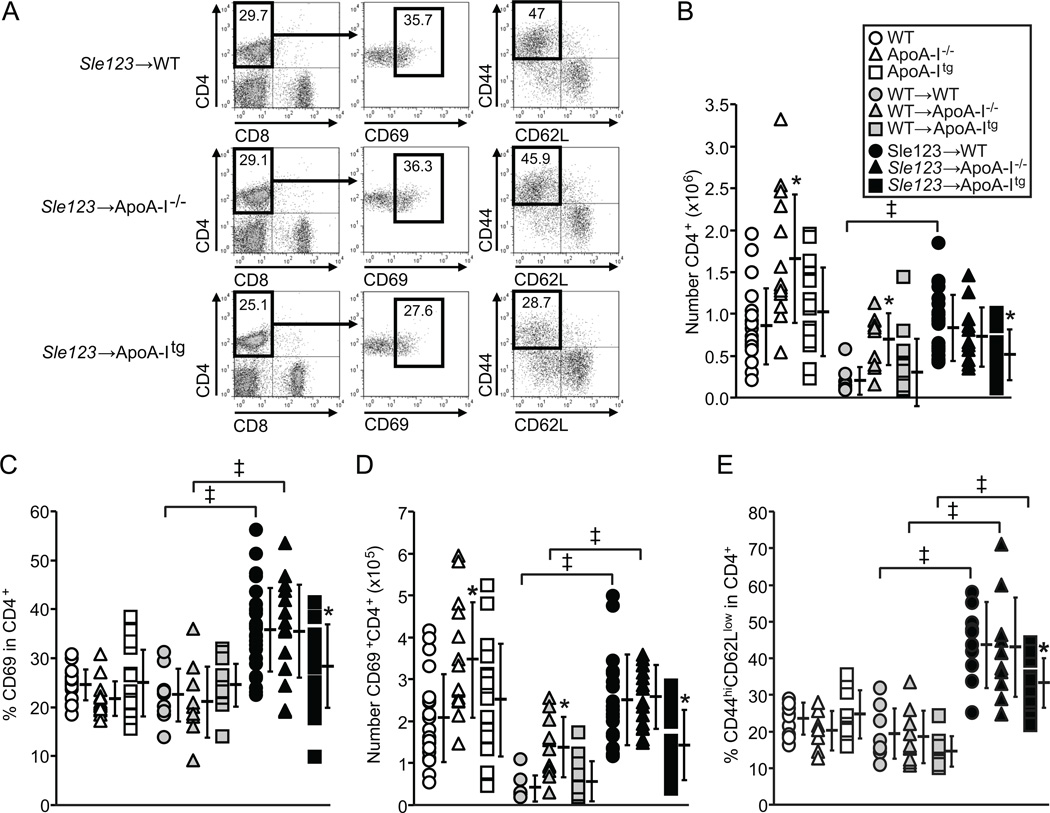
Figure 3.
Reduced numbers and activation of CD4+ T lymphocytes in Sle123→ApoA-Itg mice. (A) Flow cytometric analysis (showing gates) of lymph node CD4+ T lymphocyte activation (measured by CD69 and CD44highCD62Llow expression) in 38 week old control, control WT BMT and Sle123 BMT mice. (B) Numbers of CD4+ T lymphocytes in lymph nodes of the indicated mice (n=12–15 control, n=10–12 control WT BMT, n=10–12 Sle123 BMT mice). (C–D) Percent and absolute numbers of CD69 expressing CD4+ T lymphocytes in lymph nodes of indicated mice. (E) CD44highCD62Llow CD4+ T lymphocytes in lymph nodes of indicated mice. Note that ApoA-I deficiency in this normocholesterolemic setting does not augment T cell activation. (All data mean ± SD, *p<0.05 by one way ANOVA within control, control WT BMT or Sle123 BMT groups, ‡p<0.05 by T test compared to control).

