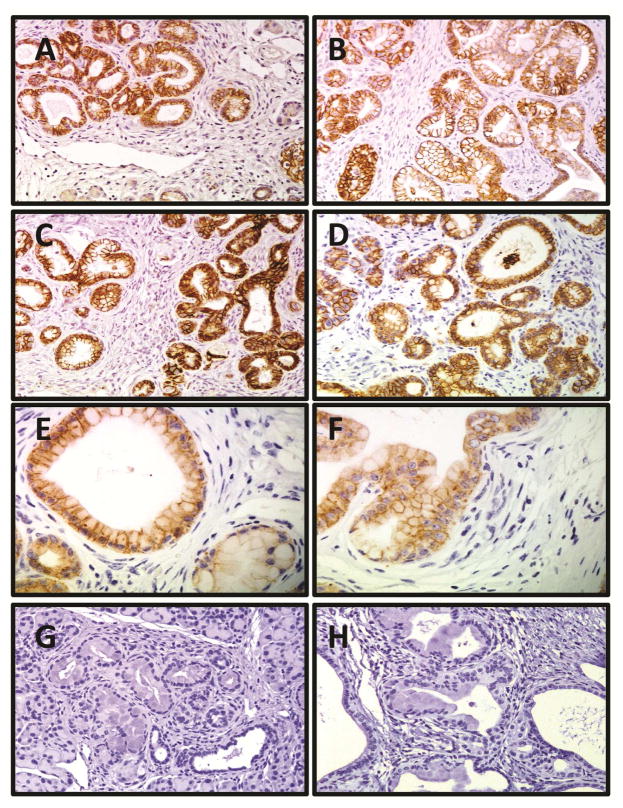
Figure 2. E-cadherin expression is strong, membranous, and ubiquitous in PanIN lesions regardless of age, diet, or PanIN stage.
Representative sections of IHC expression of E-Cadherin in mouse pancreata (age, diet): 20× magnification image of (A) 3-month, CD, (B) 3-month, HFCD, (C) 9-month, CD, and (D) 9-month, HFCD mice. (E) 40× magnification view of low-grade PanIN lesion in CD fed mouse, and (F) 40× magnification view of high-grade PanIN lesion in HFCD demonstrating similar E-cadherin staining pattern. 20× magnification images of (G) 3-month and (H) 9-month HFCD fed mice using isotype-matched control rabbit IgG demonstrating lack of nonspecific binding.

