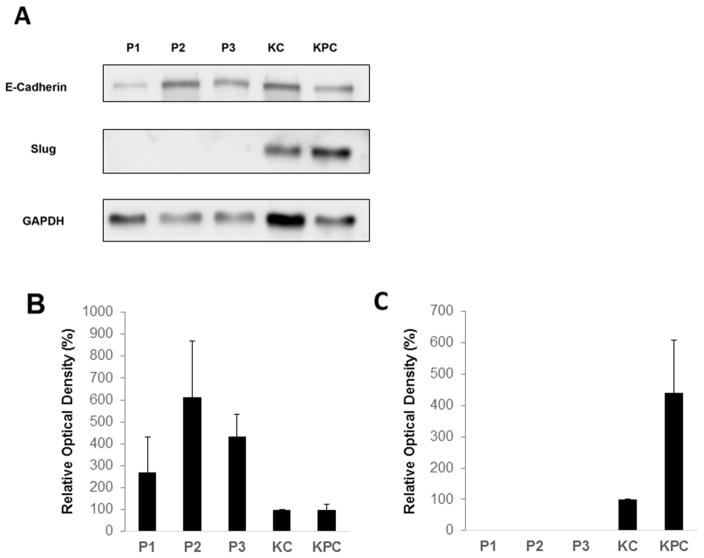
Figure 4. In-vitro expression of E-cadherin and upstream EMT transcription factor Slug in primary mouse PanIN and pancreatic cancer cells.
(A) Representative Western blot demonstrating expression of E-cadherin, Slug, and GAPDH in PanIN cell lines P1, P2, and P3 relative to KC and KPC cancer cell lines. (B) Densitometric analysis of E-cadherin expression in PanIN, KC and KPC cells. (C) Densitometric analysis of Slug expression in PanIN, KC and KPC cells (no identifiable Slug expression present in PanIN cell lines). For (B) and (C), relative optical density is measured as an average of 4 separate western blots after normalization to GAPDH. Standard deviation bars are shown. Student’s t-test for the mean was performed to obtain the reported p-values.

