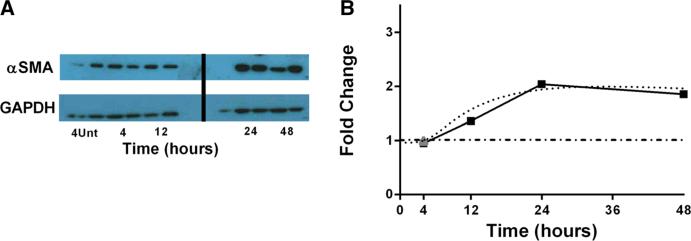
Fig. 2.
(Colour figure online) α SMA time course studies and simulations. a α SMA measured in 3T12 fibroblasts at either 4h untreated or 4, 12, 24, or 48h treated with 1 ng/ml of activated TGF-β1 using Western blot and densitometry analysis. N = 2/condition. b Simulation of α SMA production. Solid line with filled squares representing the experimental data described in part (a) and gray triangle representing 4-h untreated sample using 3T12 fibroblast cell line and 1 ng/ml of activated exogenous TGF-β1, dotted curve representing simulation results following treatment with 1 ng/ml of activated exogenous TGF-β1, and PGE2 inhibition, and dot-dashed line representing simulation control with no TGF-β1 treatment. We have previously published similar kinetics using 2 ng/ml TGF β, suggesting that TGF-β1 is in excess in this system (7)

