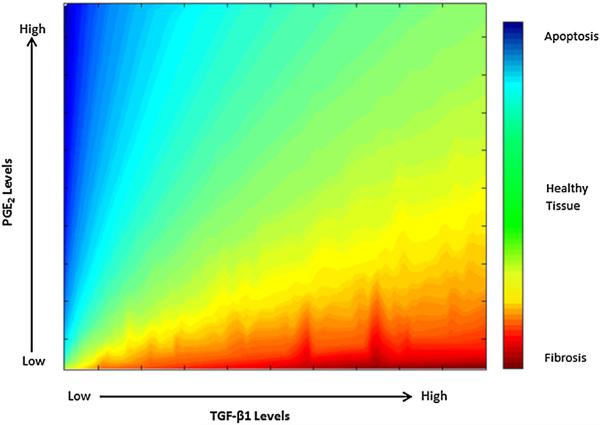
Fig. 7.
Predicted response outcomes across different TGF-β1-to-PGE2 ratios. We compare α SMA concentrations of a fibroblast under different ratios of TGF-β1 to PGE2 for 24h in the model (1)–(10). The x-axis represents the concentration of TGF-β1, and the y-axis represents the concentration of PGE2. The color gradient represents the level of α SMA produced in response to these levels of TGF-β1 to PGE2. Blue corresponds to low concentrations of α SMA likely leading to fibrosis, and red corresponds to high concentration of α SMA likely leading to apoptosis (Tomioka et al. 2007; Ley et al. 2011). Plotted are the steady-state concentrations of α SMA at 24h for these TGF-β1 to PGE2 levels. A balance of these mediators leads to the best outcome: When moderate levels of αSMA are produced (green) (Color figure online)

